The Students
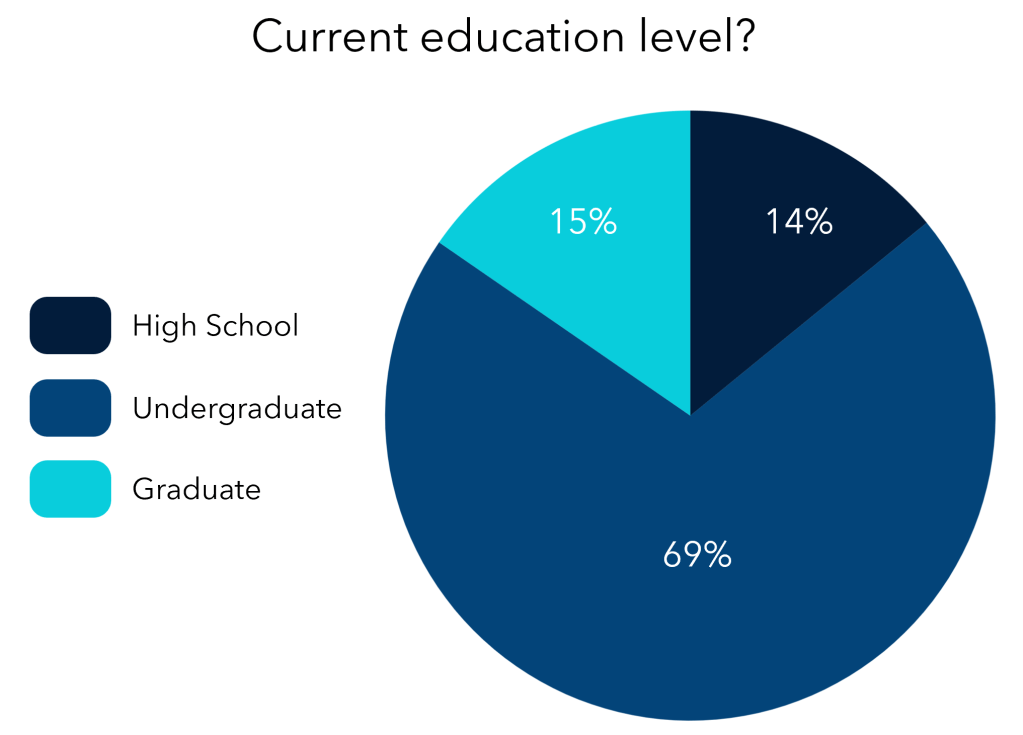
At first, the survey was meant to be only for university students. However, high school students performed about the same statistically, so they are included in the results. A total of 80 students were surveyed. The survey consisted of the same eleven questions you answered on the homepage.
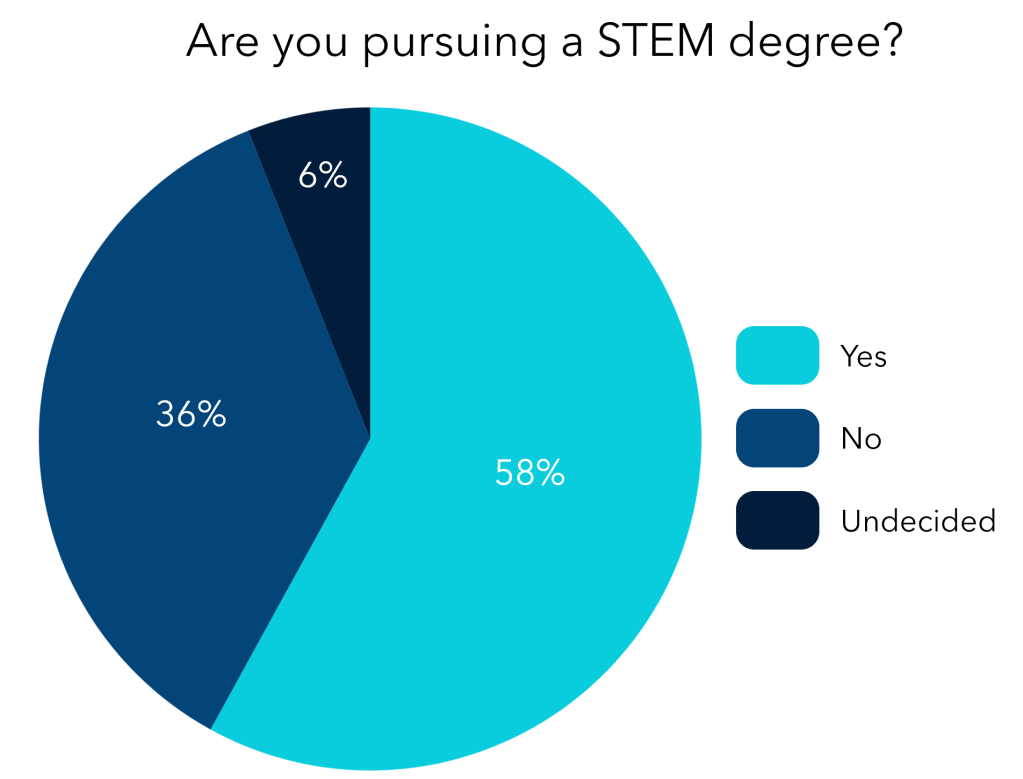
Many of the respondents were found to be pursuing a degree in a STEM field. It is natural to ask if these students performed better than those unsure or uninterested in STEM. They do. These participants were found to perform about 8% better on the survey. Those pursuing a STEM degree had an average score of 9.18 while their non-STEM counterparts had a mean of 8.34. This may not seem like much, but it was found to be statistically significant.
Students were also asked how they believed the average person would perform on the survey.
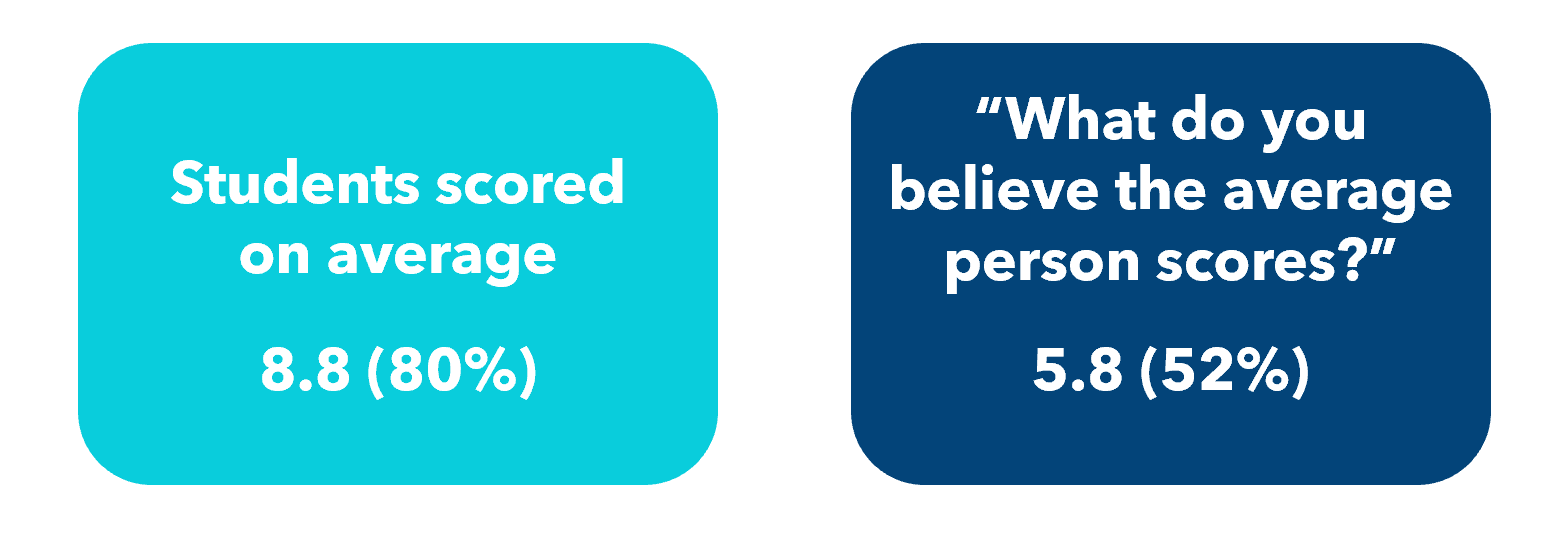
As expected, 50% falls within the margin of error
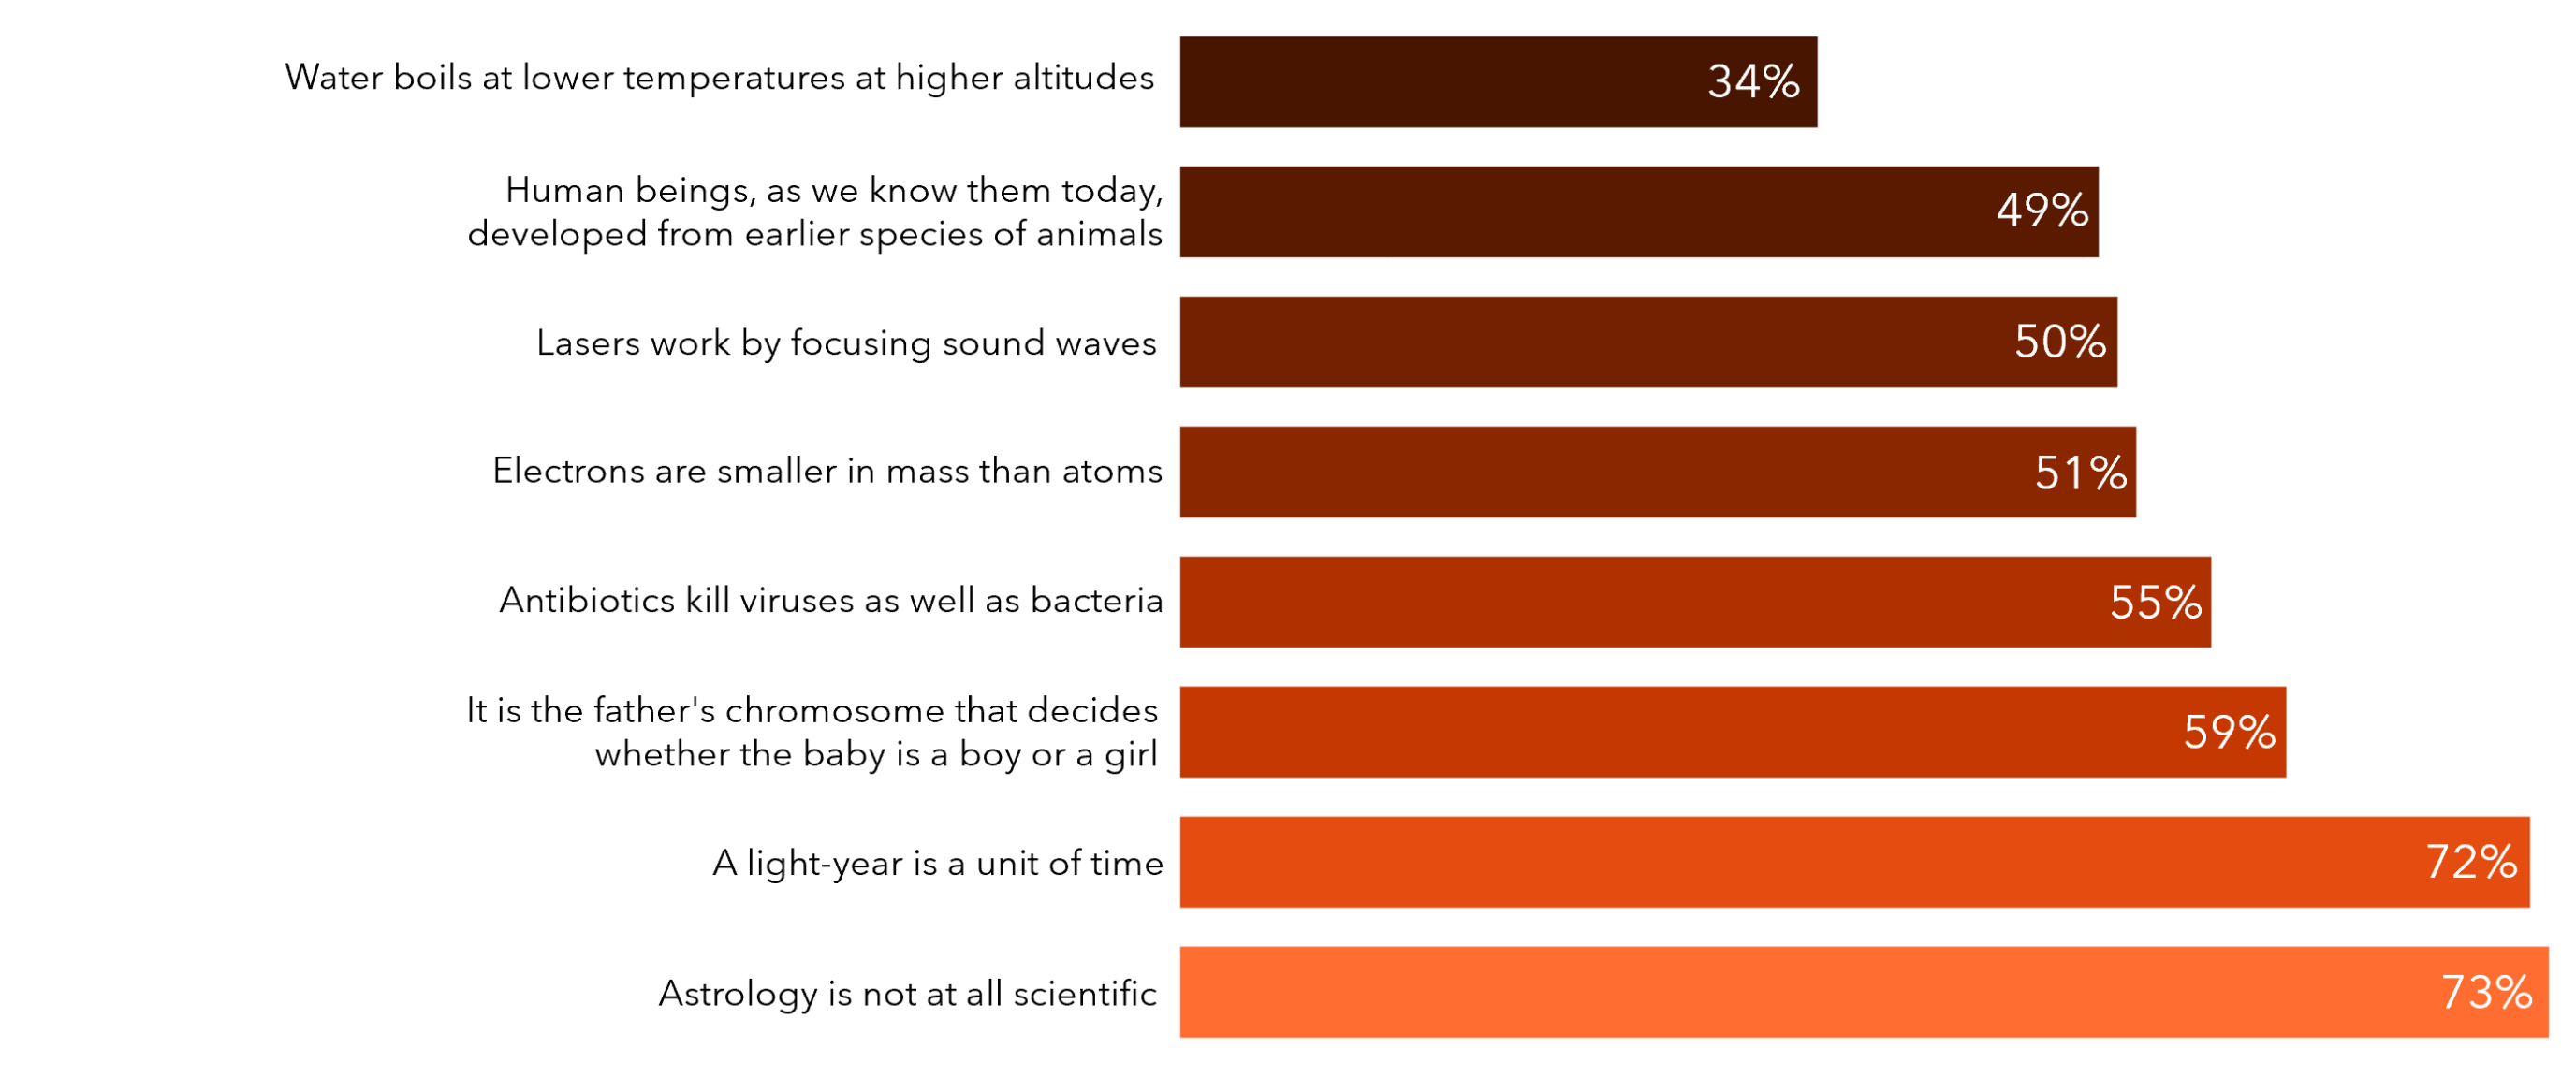
This is the participant performance on an individual question basis

The Average American
These are results from the Pew Research Center and the National Science Board
One interesting quote from someone taking the survey
“I could almost feel smoke startin’ to come outta my head!”
~fellow participant
How do they compare?
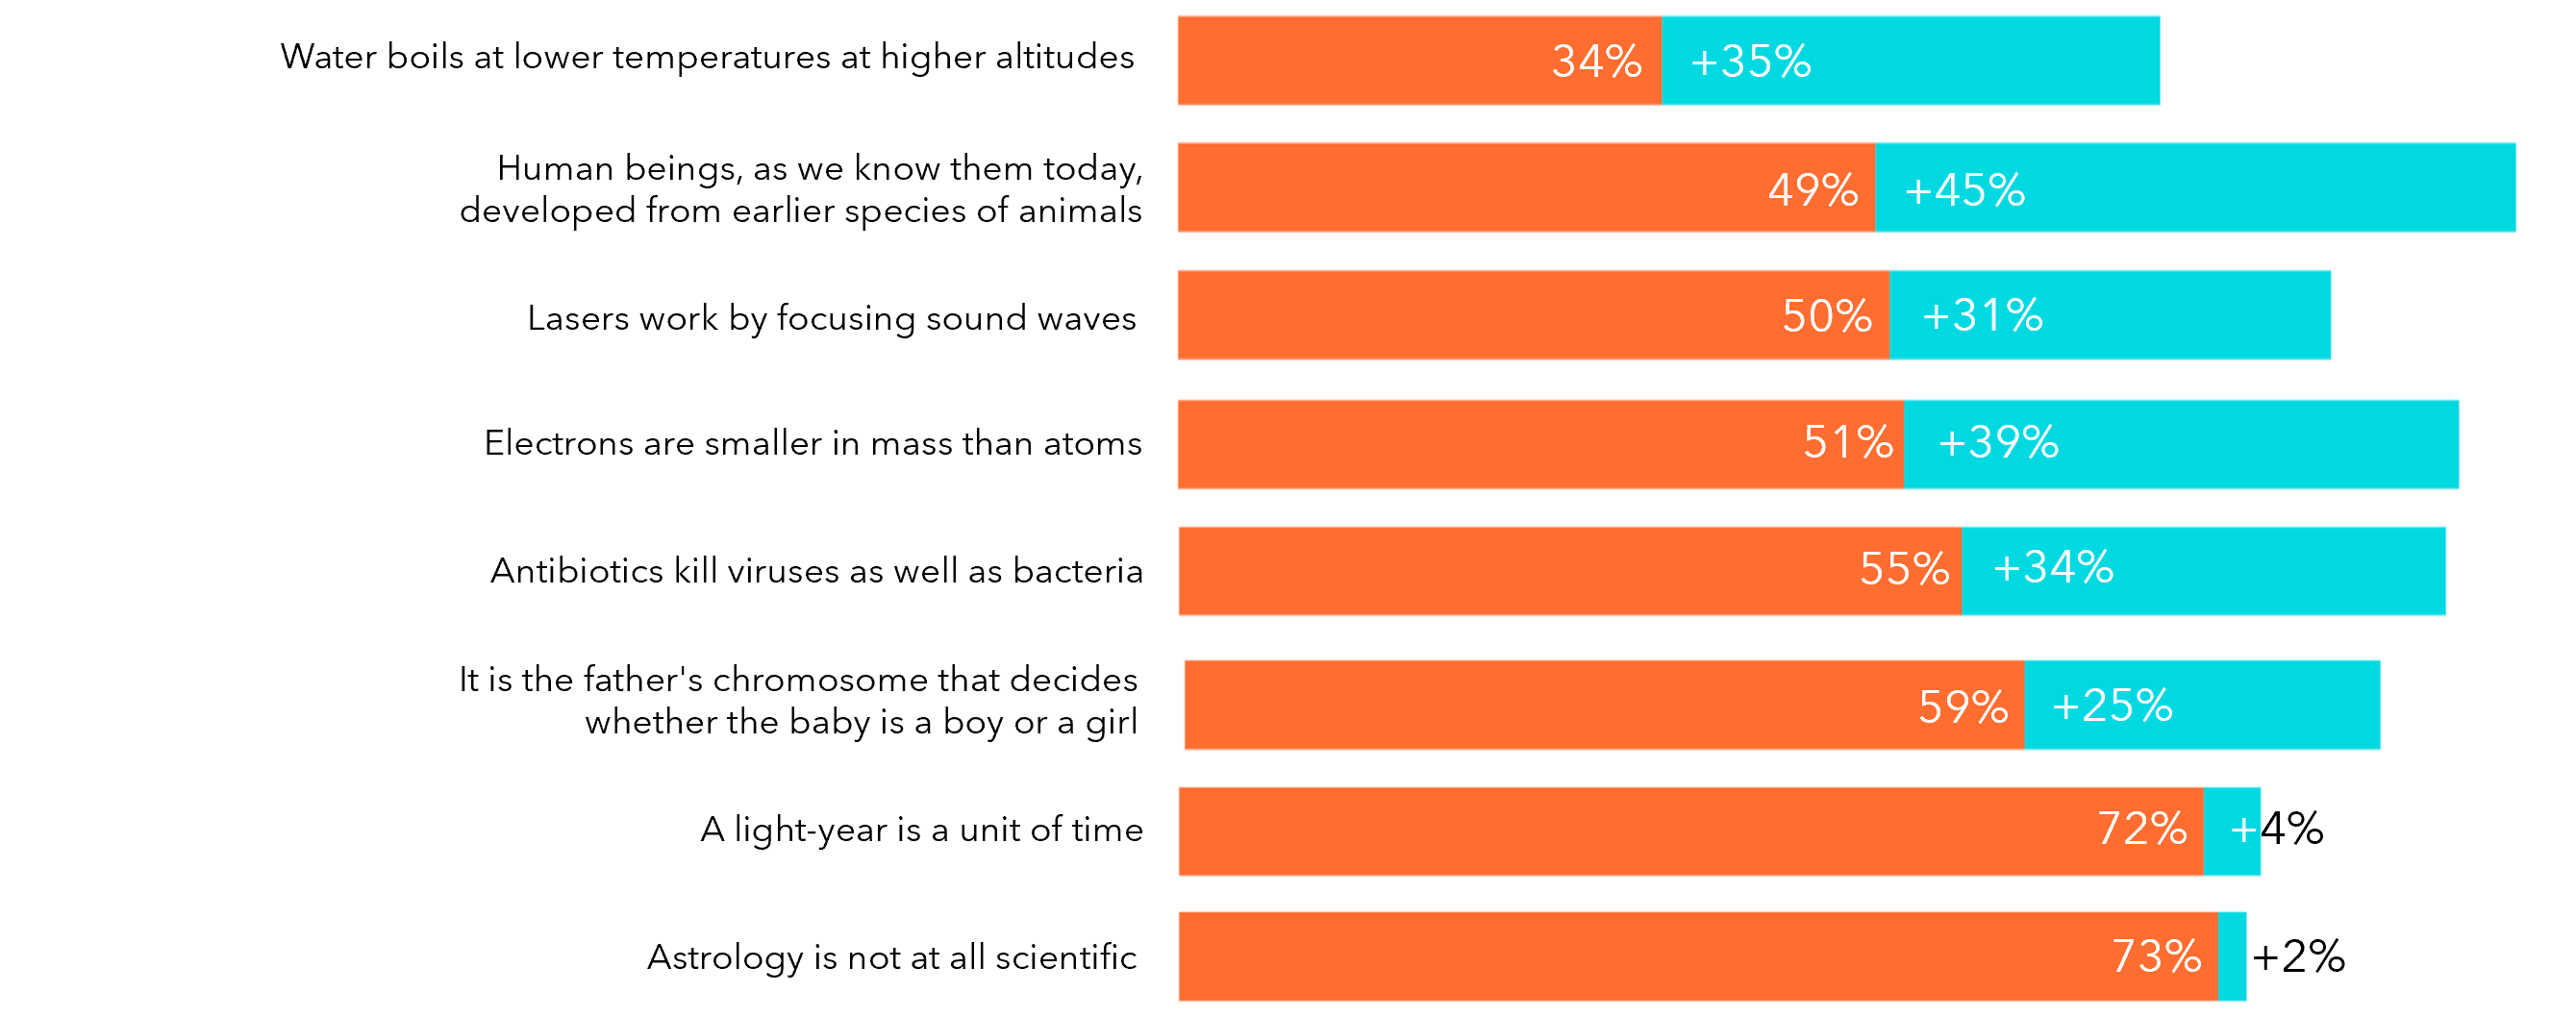
As many may have expected, students performed better than the average person on all questions. An interesting observation is that the questions students seemed to find most difficult were the most often correctly answered by the average person. The vapor-pressure question proved difficult for both groups. It was expected that there would be a large difference in the evolution-related query since this unfortunately remains a ‘controversial’ topic. It is also surprising that the average person did so poorly on the antibiotic question considering the looming doom of antibiotic resistance is covered on the news fairly often. I expected the biology question to be one of the most difficult and the atom and laser questions to be the easiest, but this does not appear to be the case.
The most interesting result is that the average person did worse than students expected.
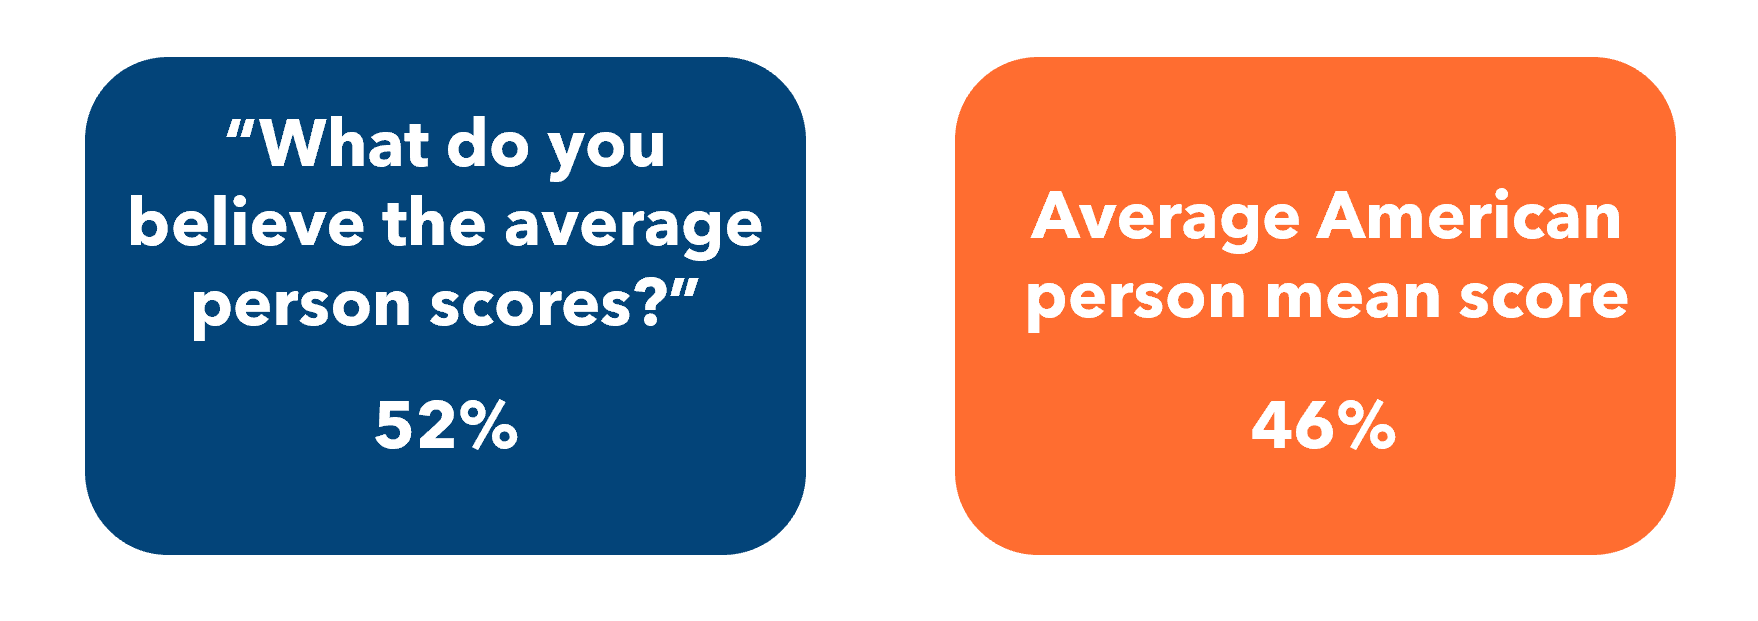
This difference turns out to fall outside margin of error and is statistically significant.
So now what? Well, if you are a university student, and especially if you are pursuing a STEM degree, remember these figures whenever you’re talking to someone about science. Realize not only that the public is misinformed, but that the degree of misinformation may be greater than what you expect. This is not to bash on science education in the US, but to bring awareness to this discrepancy and to hopefully make you, the student, a more empathetic and thoughtful communicator.
If you did poorly on the survey, do not feel bad for you are not alone. The answers along with relatively simple explanations can be found under “The Answers” at the top of this page.
If you are interested, here is the data:
